
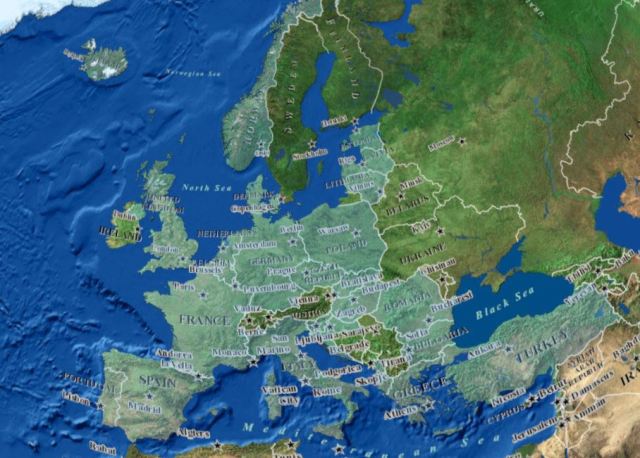
The North Atlantic Treaty Organization (NATO) was formed in1949 and consisted of 12 members. Since then, it has expanded to 28 members with the most recent being Croatia and Albania in 2009. The maps below show
1) the European Allies
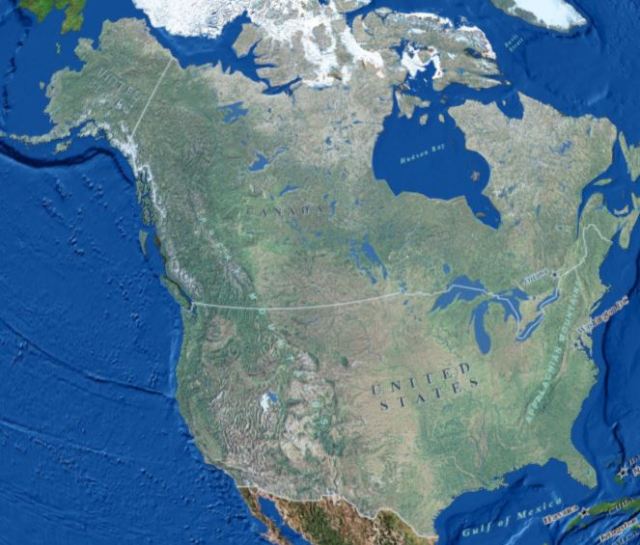
2) the North American Allies
One consistent source of debate over the years has been the issue of burden sharing or how much each member contributes to the alliance. This issue has been raised again in the 2016 Presidential debate (not exclusively to NATO).
Focusing on NATO, there are two ways that countries contribute to NATO. The first are direct contributions. NATO defines these as
“Direct contributions are made to finance requirements of the Alliance that serve the interests of all 28 members – and are not the responsibility of any single member – such as NATO-wide air defence or command and control systems. Costs are borne collectively, often using the principle of common funding.”1
NATO uses the Gross National Income of a country to determine their share of the direct costs. This is from the NATO website (2):
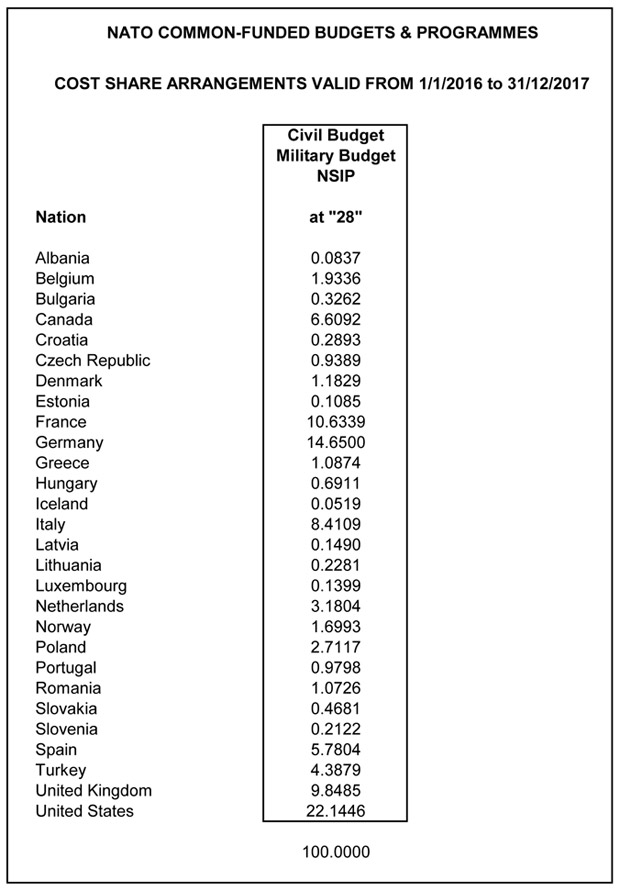
As you can see, the US has the greatest share at 22%, followed by Germany at 14%, France at 11%, and the UK at 10%.
Without going into too many details, the other form of burden sharing is what NATO calls “indirect funding”. This is what most people discuss. When a mission is approved by NATO’s decision making body, individual countries offer soldiers and equipment for that mission. The one caveat to this is if a NATO member has been attacked and invokes the collective defense clause of the alliance treaty (Article 5, invoked by the US after 9/11).
What a country can offer for a mission is influenced by the size of their overall military. NATO in 2006 asked for all members to spend at least 2% of their GDP on defense. The table below lists defense spending as a percentage of GDP for 2015 (data is from 3).
| Country | Defense as percent of GDP- 2015 | Millions US$ 2015 |
| US | 3.62 | 649,931 |
| Greece | 2.46 | |
| Poland | 2.18 | |
| UK | 2.07 | 59,699 |
| Estonia | 2.04 | |
| France | 1.8 | 43,864 |
| Turkey | 1.69 | |
| Norway | 1.49 | |
| Romania | 1.44 | |
| Portugal | 1.39 | |
| Croatia | 1.38 | |
| Bulgaria | 1.2 | |
| Denmark | 1.18 | |
| Germany | 1.18 | 39,743 |
| Albania | 1.16 | |
| Netherlands | 1.16 | |
| Lithuania | 1.14 | |
| Slovak Rep. | 1.12 | |
| Latvia | 1.06 | |
| Canada | 1 | |
| Czech Rep. | 0.97 | |
| Italy | 0.95 | 18,271 |
| Slovenia | 0.95 | |
| Belgium | 0.9 | |
| Spain | 0.89 | |
| Hungary | 0.85 | |
| Luxembourg | 0.47 |
This table does not tell us how much each country contributes to NATO missions, just how much they spend on defense as a percentage of GDP. As a measure, it lets you see how countries are doing in meeting the 2% rule but it does not tell you how much each country is indirectly contributing to NATO.
